The reliability of an identification system is measured by the reliability of the single operations. This may vary depending on the quality of the samples in the gallery or in the probe set. For example a sample taken under controlled condition is surely more reliable than a “degraded” or “avderse” sample, which may lack of quality and uniform lighting distribution.
We can measure the quality of the images in the system by creating an average template from all the templates in the system, and then take the quality of this as a reference. Also the sharpening (lack of sharpening is equal to blur) can affect quality.
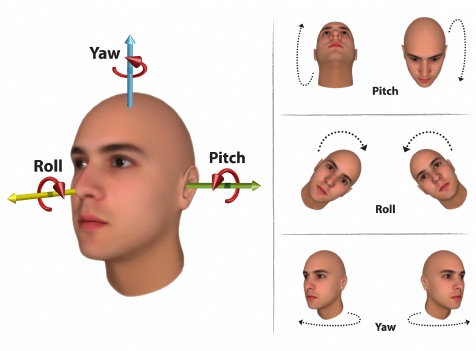
Another important thing that affect quality if we’re working with faces as samples is the pose, that’s described as:
- Roll: the rotation around the axis, perpendicular to the face; This can be easily corrected by taking the centers of eyes and the line that join the centers of eyes, compute the angle and rotate the face image in the opposite direction;
- Pitch: the rotation around the axis; This is difficult to fix since because, even if there is some symmetry in the central point of the face (distance between center of eyebrows, nose and mouth) this distances are not equivalent for every person.
- Yaw: the rotation acround the axis. This cannot be alway corrected because an image with a large rotation over the axis means that we loose information about the face.
Score Pose
Given an image of a face, it’s possible to calculate its Score Pose
Now let’s calculate a value for roll, pitch and yaw:
- Roll can be measured by drawing a line that connect the center of the eyes and taking that angle with respect to the axis;
- Yaw can be calculated by taking the distance from the center of the left eye to the point of the nose () and the same with the right eye (). We’ll have . The more the face is frontal, the lower the difference between these two values;
- Pitch can be calculated by taking the distance between the center of the eyebrows and the tip of the nose () and the distance between the region above the nose tip and the chin (). We’ll have .
Score illumination
The illumination score is a measures of homogeneity of grey levels in some face regions.
Score symmetry
The symmetry score is a measure of face symmetry, and it’s computed as the sum of the symmetry between points the edges of the face.
The purpose of calculating this scores is to discard images that are of poor quality in advance, in order to only have images that are more suitable for recognition.
We can also have another threshold, different from the standard one, that’s used only when the decision involved images with bad quality
SRR - System Response Reliability
System Response Reliability is an index between 0 and 1 that measures the ability of an Identification system to separate correctly genuine subjects and impostor subjects on a single probe basis. It basically gives the “confusion” index between the subjects.
The index depends on the function . There are two different implementation of this function.
The function itself measures the level of confusion in the system but it’s not equal to the SRR, since it has to be normalized.
Both functions relies on the fact that a critical point exists, that marks the point of maximum uncertainty, which varies with the biometric trait and the classifier.
Relative distance
The function is based on the fact that the result of an identification operation is not only the returned identity, but the ordered list (the first part of it) of distances between the probe and the other templates in the gallery.
It’s possible to imagine a cloud around the returned subject, where the templates near the subject have a low distance and the far templates have an high distance between the subject’s probe.
If the cloud is less crowded, this means that the templates in the gallery have an higher distance with the probe, and so the response can be interpreted as more reliable.
If the cloud is more crowded, this means that there are more templates of subjects that are more similar to the probe, so the response is less reliable.
Given a probe , a system and a gallery , the function is defined as:
The denominator contains the difference between the first returned distance and the second. This value is divided by the highest distance on the list.
The lower is, the lower is the reliability of the system.
If is very high, this means that the difference between the first and the second template distances is very close to the maximum absolute distance
Density ratio
The density ratio is defined as
Where
We count how many features on the list have a distance from the probe that’s less than twice the first distance, and we divide this number by the number templates in the gallery. The factor was decided since no other factor achieves better results.
This function performs better than Relative Distance function since it less sensible to outliers (templates with a distance very far from the probe).
The distance between and is significant for the reliability. Farther this distance, the better, because it means that the system is far from the critical point.
Once we have computed the factor, we can define the SRR as:
Where
Reliability threshold
The reliability threshold allows us to reject an apparently correct identification due to the fact that we don’t consider it reliable enough.
This can be calculated by exploiting a certain number of successive observations on the identification operations. It’s formally defined as: